Data Mining Concepts explained

Welcome to my world of Internet of Things and Cloud Computing. I received my bachelor's degree in the discipline of Internet of Things. I also write technical articles. I am now pursuing a Masters degree in Cloud Computing. I am an Amazon Web Services Certified Cloud Practitioner.
Hello readers 💁♀️!!
This article would be lengthy because it covers all of the important data mining topics you should be aware of. So plan on having some patience ahead of time 😝.
Introduction to Data Mining
We have large amounts of data. This world is data rich but information poor. Right? For example, large stores, such as Wal-Mart, handle hundreds of millions of transactions per week at thousands of branches around the world.
Data mining converts a large amount of data into knowledge.
Every day, search engines (such as Google) receive hundreds of millions of queries. Each query can be thought of as a transaction in which the user describes his or her information requirement. What novel and useful knowledge can a search engine glean from such a massive collection of user queries accumulated over time? Surprisingly, some patterns discovered in user search queries can reveal valuable information that cannot be obtained by reading individual data items alone. This process of gathering data and making sense of it is called Data Mining.
✨What is Data Warehouse?
A data warehouse is a repository of information collected from multiple sources, stored under a unified schema, and usually residing at a single site. The data are stored to provide information from a historical perspective ,such as in the past 6 to 12 months, and are typically summarized. Loosely speaking, a data warehouse refers to a data repository that is maintained separately from an organization’s operational databases.
✨What Kinds of Data Can Be Mined?
- Time-related or sequence data (e.g., historical records, stock exchange data, and time-series and biological sequence data),
- Data streams (e.g., video surveillance and sensor data, which are continuously transmitted),
- Spatial data (e.g., maps),
- engineering design data (e.g., the design of buildings, system components, or integrated circuits),
- Hypertext and multimedia data (including text, image, video, and audio data),
- Graph and networked data (e.g., social and information networks),
- Web (a huge, widely distributed information repository made available by the Internet).
✨Know your Data
It’s tempting to jump straight into mining, but first, we need to get the data ready. This involves having a closer look at attributes.
An attribute is a data field, representing a characteristic or feature of a data object.
“So what can we learn about our data that’s helpful in data preprocessing?” Let's begin by studying the various attribute types. These include nominal attributes, binary attributes, ordinal attributes, and numeric attributes.
- Nominal attributes - Nominal means “relating to names.” The values of a nominal attribute are symbols or names of things.
- Binary attributes - A binary attribute is a nominal attribute with only two categories or states :0 or 1, where 0 typically means that the attribute is absent, and 1 means that it is present. Binary attributes are referred to as Boolean if the two states correspond to true and false.
- Ordinal attributes - An ordinal attribute is an attribute with possible values that have a meaningful order or ranking among them, but the magnitude between successive values is not known.
✨Data Visualization
How can we convey data to users effectively? 🤔🤔
Data visualization aims to communicate data clearly and effectively through graphical representation. Data visualization has been used extensively in many applications—for example, at work for reporting, managing business operations, and tracking progress of tasks.
✨Data Pre-processing
Think of a question💭 - “How can the data be preprocessed in order to help improve the quality of the data and to improve the efficiency and ease of the mining process?”
Answer to this question 👉 - There are several data preprocessing techniques such as data cleaning, Data integration , Data reduction, and Data transformation.
- Data cleaning - It routines work to “clean” the data by filling in missing values, smoothing noisy data, identifying or removing outliers, and resolving inconsistencies.
- Data integration - It merges data from multiple sources into a coherent data store such as a data warehouse
- Data reduction - It obtains a reduced representation of the data set that is much smaller in volume, yet produces the same (or almost the same) analytical results. Data reduction strategies include dimensionality reduction and numerosity reduction.
- Data transformation - It converts the data into appropriate forms for mining.
✨Data Warehouse Models
- Enterprise warehouse - An enterprise warehouse collects all of the information about subjects spanning the entire organization. It provides corporate-wide data integration, usually from one or more operational systems or external information providers, and is cross-functional in scope.
- Datamart - A data mart contains a subset of corporate-wide data that is of value to a specific group of users. The scope is confined to specific selected subjects. For example, a marketing data mart may confine its subjects to customer, item, and sales. The data contained in data marts tend to be summarized. Data marts are usually implemented on low-cost departmental servers that are Unix/Linux or Windows based. The implementation cycle of a data mart is more likely to be measured in weeks rather than months or years
- Virtual warehouse - A virtual warehouse is a set of views over operational databases. For efficient query processing, only some of the possible summary views may be materialized. A virtual warehouse is easy to build but requires excess capacity on operational database servers.
✨What is Data Cube? 🤔
The data cube is a metaphor for multidimensional data storage. The actual physical storage of such data may differ from its logical representation. A data cube allows data to be modeled and viewed in multiple dimensions. It is defined by dimensions and facts.
- Dimensions are the perspectives or entities with respect to which an organization wants to keep records.
- Facts are numeric measures.
The important thing to remember is that data cubes are n-dimensional and do not confine data to 3-D.
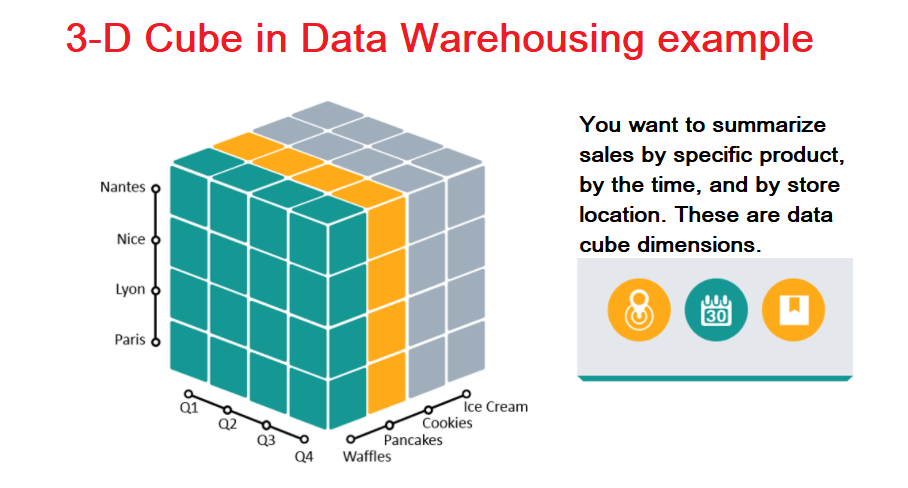 In this example, the data warehouse 3-dimensional structure is presented. The data cube includes 3 dimensions: location, time period, and products. Think about how you could incorporate this strategy to present your own message in a visually appealing way.
Picture from: info diagram
✨Stars, Snowflakes, and Fact Constellations: Schemas for Multidimensional Data Models
- Star schema 🌟 - The most common modeling paradigm is the star schema, in which the data warehouse contains (1) a large central table (fact table) containing the bulk of the data, with no redundancy, and (2) a set of smaller attendant tables (dimension tables), one for each dimension. All the dimension tables are connected to Fact table, which looks like a star 🌟.
Snowflake schema - The snowflake schema is a variant of the star schema model, where some dimension tables are normalized, thereby further splitting the data into additional tables. The resulting schema graph forms a shape similar to a snowflake.
The major difference between the snowflake and star schema models is that the dimension tables of the snowflake model may be kept in normalized form to reduce redundancies
Fact constellation - Sophisticated applications may require multiple fact tables to share dimension tables. This kind of schema can be viewed as a collection of stars, and hence is called a galaxy schema or a fact constellation.
I also recommend other articles based on data mining:
Thanks you for reading this article. If you found any mistake, please give feedback in comments 💭section.
Happy learning !!💜


